 What is the connection between data availability, backup product costs and data risk. How do you ensure your business data are protected while also balancing your data protection budget? Let’s learn about how to balancing your data protection budget against your business data availability.
On our previous post, Your last stop before applying your RPO/RTO, we discussed the importance of making the right decisions when setting up your services recovery. We also discussed the deeper aspects of the recovery process, and the steps of the recovery cycle.
In this post, we will discuss how you should balance your business budget against the right data protection products, based on these important considerations:
- business needs;
- tolerance for data loss;
- risk mitigation; and
- total IT budget.
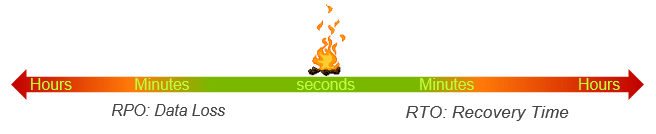
As is usual with every data availability product, the journey starts with the RPO/RTO scale we discussed in our previous blog. If you look at the diagram below; you can see that we added a strike point at the middle of the timeline to reference our discussion; it can also be called the disaster point. The aim of every business is to minimise that gap between the strike point and the RPO/RTO time. The closer your backup and recovery time is to the strike point, the better your business is protected against data loss, and the closer you are to providing full service again after a disaster.
Also, remember that the closer your RPO/RTO times are to the strike point, the higher the cost of your data availability solution, but conversely, the further your RPO/RTO from the strike point, the higher the risk to your business.
Does your business really need to be very close to the strike point, or can you still meet your business need by being a little further back? Remember, the closer you are, the more it will cost your business. It is always a balance between cost and risk.. Confusing? Let’s keep going.
Risk to the Business; Data Loss and Systems Downtime
There are many different types of business risk, they can also directly or indirectly affect the business’s ability to operate.With our example, risks to the business must be considered, and can include:
- System Availability
- Service Availability
- Customer’s satisfaction
- Revenue loss; and
- Damage to reputation
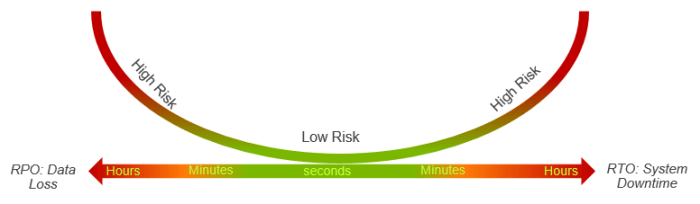
We have to examine the risk and tolerance for data loss and system downtime to our business.
From the below diagram we can see that the farther the business RPO (Data backup, frequent of backup etc…) from the strike point, the higher the risk. The risk will steadily decrease up as we move towards the strike point, and will increase again as time is expended on the recovery process. If the recovery process is fast, then the risk will be low, though will increase again with a longer RTO.
Cost to the Business; Data Loss and Systems Downtime
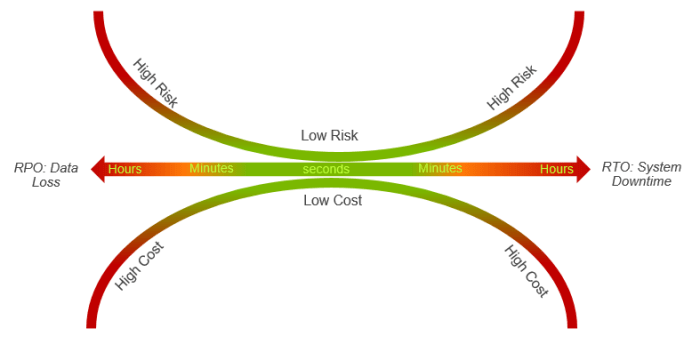
Cost is the penalty the business will pay in the event of a disaster. The cost we will examine on this post is the financial cost associated with the business data loss and the business system downtime. In the same manner as risk, the longer the business RPO (Data backup, frequent of backup etc…) the higher the cost associated with the data loss, at the start, then decreasing closer to the strike point. Cost will start increasing again during the recovery time. The faster the RTO, the lower the cost.
Lets add the cost to our RPO/RTO line:
Remember, at this point, you will quickly find that your business has different systems and data sets, each with a different tolerance for data loss and time to restore availability. It is important now that you work with each business unit to maximize the protection of your whole business.
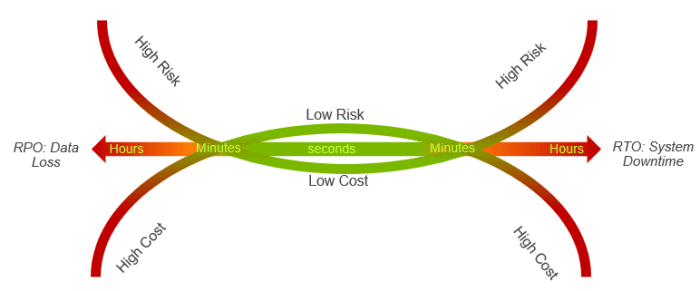
Now that we have added the risk and cost variables for business tolerance and system downtime to our RPO/RTO diagram, we are able to determine the best data tolerance for our business. Our diagram shows both RPO and RTO, and their risk and cost variables; the intersections of those variables are the ideal points for our business to begin looking at data and system protection products, and to determine the investment we must make to achieve our level of protection that we have just calculated we need.
Conclusion
Simply, the above graph will help you and your business to chose the right solution for your data protection based on your business tolerance for data loss and budget. The graph will also show that not all of your data will be treated equally, and you do not have to shop for the most expensive backup products. Of course, each business is different, and each data set and service must be examined carefully before choosing the right solution.
If you are shopping for a new solution, our presentation and graphs will be a great asset to you and your company.
